
Audio Spectrogram Analysis
Audio Spectrogram Analysis is the scientific examination of acoustic field recordings through digital signal processing (DSP) and Fast Fourier Transform (FFT) algorithms. By converting recorded audio from a simple two-dimensional waveform (amplitude over time) into a three-dimensional visual spectrogram (frequency, amplitude, and time represented via color heatmaps), researchers can visually dissect the exact spectral signature of suspected Electronic Voice Phenomena (EVP) and anomalous sounds.
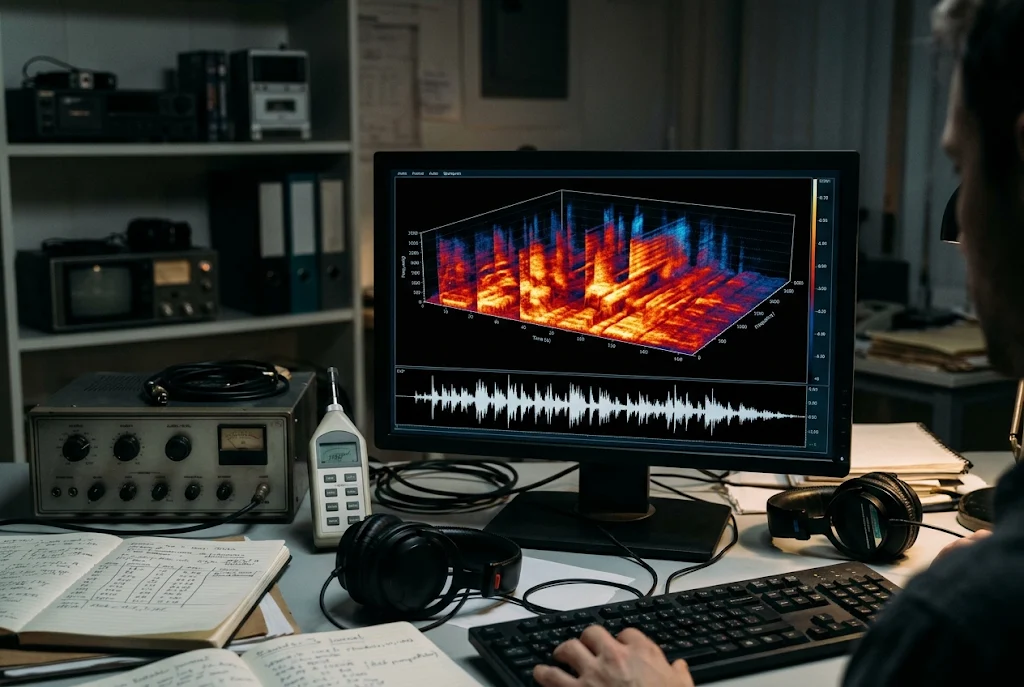
In biometric linguistics and parapsychological research, genuine human vocal speech produces distinct, harmonic acoustic resonances known as formants (specifically F1, F2, and F3 bands) generated by the physical vocal cords, larynx, and oral cavity. When analyzing a captured voice anomaly, analysts evaluate whether the signal exhibits organic harmonic formant structures or if it consists of randomized broadband noise, mechanical friction, or radio frequency bleed-through that the human brain has retroactively fitted into speech through auditory pareidolia.
Rigorous spectrogram review also serves as an indispensable tool for environmental debunking. Infrasound rumbles from distant highway traffic, ultrasonic harmonics from failing electronic switch-mode power supplies, plumbing pipe resonance, and high-frequency insect stridulation can all be identified and isolated by their characteristic frequency footprints. Utilizing calibrated 24-bit/96kHz uncompressed WAV recordings ensures that lossy compression artifacts do not corrupt the spectral data.
Was this document helpful?
Thank you for your feedback!